Mitsui Sumitomo Banking Tsumitate(reserve) NISA has a lot of information
It's been a while since my mother joined Sumitomo Mitsui Banking's Tsumitate NISA.
Due to the dramatic changes in the world situation over the past few months, price movements in stock prices not only in Japan but also in the United States and around the world have become unstable.
The bank's NISA profit and loss status can be seen from the app installed on the mobile phone, but if you want to see the charts and other details of the daily stock price fluctuations that affect NISA, you need to go to the official web page.
You can jump to the relevant page from here ↓
What is Tsumitate NISA? : Sumitomo MitsuiBanking Corporation (smbc.co.jp)
The image below is what I saw on my computer.
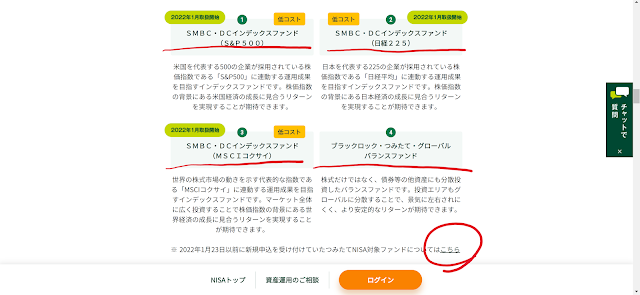
If you scroll down a little, you can see about 4 funds in the section of "Tsumitate NISA eligible products".
Please press the name of the fund you are using to move to the relevant page.
If it is not among the four, please press the "here" circled in red.
If you move to "here", as of July 20, 2022, three funds are listed.
My mother uses "Sumitomo Mitsui DC Tsumitate NISA All Overseas Equity Index Fund", so I would like to explain this as an example.
By the way, did you know that there are different types of Tsumitate NISA?
It seems that my mother signed the contract as recommended, and she didn't receive much explanation about it.
Since it was my first investment, the store clerk introduced me to the fund with the least risk.
Investment performance
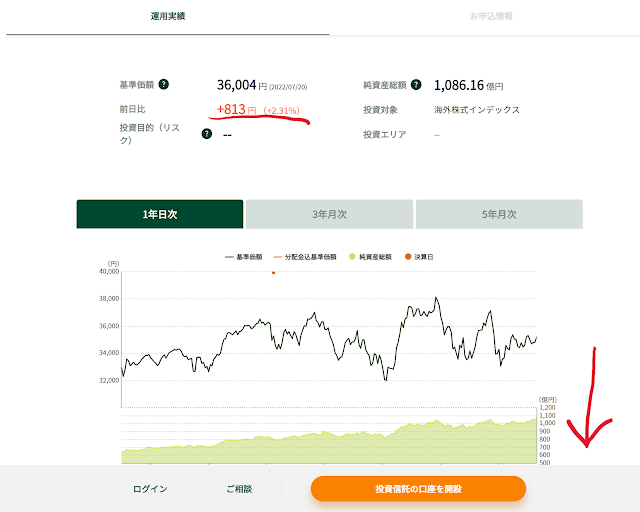
After selecting the fund and moving to the corresponding page, scroll down a little and you will see the "performance results".
You can also see the year-on-year comparison here.
It seems that July 20th was quite positive.
It's been a relief since the minus has been continuing lately.
Also, since the chart is also displayed, it
is useful to grasp the direction of NISA's profit and loss.
Let's scroll further.
Below the chart, there are tabs for "Multi-function chart" and "View market index comparison chart".
Please press "Multi-function chart".
Multifunction chart
The multi-function chart is similar to the previous performance chart, but you can display the performance status of the date you put the pointer on the chart.
Since you can look back on the past, it is useful to check the date when you started using it, the date when you increased the amount of investment, the date when the price surged and crashed, etc.
Next, let's go back one step and look at the "Market Index Comparison Chart".
The chart is also displayed here.
By using "Select indices to compare", you can display specified indices on this chart at the same time.
Market Index Comparison Chart
Indices are roughly divided into four categories: stock prices, foreign exchange, government bond yields, gold, crude oil, etc.
If you press the desired tab, it will spread out, so check the checkbox from among them and press "Display chart with the above settings" at the bottom to reflect the specified index on the chart.
Please go back one more time.
Finally, let's display "See more details such as rate of change and settlement information".
Rate of rise and fall, financial information, etc.
You can increase your assets efficiently by buying a lot when the investment is cheap.
Even though it is a solid NISA, I feel the need to adjust the amount of reserves while watching the fluctuations in stock prices.
When you say NISA, you may have a strong feeling that everything is left to you.
There is not much interest in devising something yourself.
Of course, the biggest attraction of NISA is that it does not take time and effort.
However, sometimes looking at the data displayed here, ``Increase investment when it is cheap'', ``Save investment when it is high'', ``Increase investment when it is trending upward'', and ``Stop investment when it is crashing'' I feel that there is still room for arbitration, such as "to do".
Why don't you use it as a material to review the investment allocation to Tsumitate NISA while taking into account the fluctuation rate, financial results, etc.?


0 件のコメント:
コメントを投稿